Networks are used by computers to communicate. These networks could be connected to the internet or a local area network (LAN). Network Sniffers are programs that capture low-level package data that is transmitted over a network. An attacker can analyze this information to discover valuable information such as user ids and passwords.
In this tutorial, you will find out how Wireshark works. We’ll walk you through where to find and how to install the Wireshark application on your PC. You will learn how to launch a packet capture and what data you might anticipate receiving from it. The Wireshark lesson will also demonstrate how to utilize the data modification tools in the interface to their full potential. You will also discover how to obtain data analysis tools that are superior to Wireshark’s built-in tools.
What is Wireshark?
Wireshark is an open-source and free network traffic inspection tool. It captures and displays packets in real-time for offline analysis in a human-readable format with microscopic details. It requires some sound knowledge of basic networking and is considered an essential tool for system administrators and network security experts.
Wireshark, formerly known as Ethereal, shows information from hundreds of different protocols across all significant network types. The analysis of data packets might be done offline or in real-time. Numerous capture and trace file types, including CAP and ERF, are supported by Wireshark. Integrated decryption tools, such as WEP and WPA/WPA2, display the encrypted packets for a number of popular protocols.
Wireshark is the de-facto go-to tool for several network problems that vary from network troubleshooting, security issue examination, inspecting network traffic of a suspicious application, debugging protocol implementations, along with network protocol learning purposes, etc.
The Wireshark project was initiated in 1998. Thanks to the global networking expert’s voluntary contribution, it continues to make updates for new technologies and encryption standards. Hence, it’s by far one of the best packet analyzer tools and is utilized as a standard commercial tool by various government agencies, educational institutes, and non-profit organizations.
History of Wireshark:
In the late 1990s, Gerald Combs, a computer science graduate of the University of Missouri-Kansas City was working for a small ISP (Internet Service Provider). The protocol at that time did not complete the primary requirements. So, he started writing Ethereal and released the first version around 1998. The network integration services own the Ethernet trademark.
Combos still held the copyright on most of the ethereal source code, and the rest of the source code was re-distributed under the GNU GPL. He did not own the Ethereal trademark, so he changed the name to Wireshark. He used the contents of the ethereal as the basis.
Wireshark has won several industry rewards over the years including eWeek, InfoWorld, PC Magazine and also as a top-rated packet sniffer. Combos continued the work and released the new version of the software. There are around 600 contributed authors for the Wireshark product website.
The functionality of Wireshark:
Wireshark is similar to tcpdump in networking. Tcpdump is a common packet analyzer that allows the user to display other packets and TCP/IP packets, being transmitted and received over a network attached to the computer. It has a graphic end and some sorting and filtering functions. Wireshark users can see all the traffic passing through the network.
Wireshark can also monitor the unicast traffic which is not sent to the network’s MAC address interface. But, the switch does not pass all the traffic to the port. Hence, the promiscuous mode is not sufficient to see all the traffic. The various network taps or port mirroring is used to extend capture at any point.
Port mirroring is a method to monitor network traffic. When it is enabled, the switch sends the copies of all the network packets present at one port to another port.
Uses of Wireshark:
Wireshark can be used in the following ways:
- It is used by network security engineers to examine security problems.
- It allows the users to see all the traffic being passed over the network.
- It is used by network engineers to troubleshoot network issues.
- It also helps to troubleshoot latency issues and malicious activities on your network.
- It can also analyze dropped packets.
- It helps us to know how all the devices like laptops, mobile phones, desktops, switches, routers, etc., communicate in a local network or the rest of the world.
Features
Wireshark has a rich feature set that includes the following:
- Deep inspection of hundreds of protocols, with more being added all the time
- Live capture and offline analysis
- Standard three-pane packet browser
- Multi-platform: Runs on Windows, Linux, OS X, FreeBSD, NetBSD, and many others
- Captured network data can be browsed via a GUI, or via the TTY-mode TShark utility
- The most powerful display filters in the industry
- Rich VoIP analysis
- Read/write many different capture file formats: tcpdump (libpcap), Pcap NG, Catapult DCT2000, Cisco Secure IDS iplog, Microsoft Network Monitor, Network General Sniffer® (compressed and uncompressed), Sniffer® Pro, and NetXray®, Network Instruments Observer, NetScreen snoop, Novell LANalyzer, RADCOM WAN/LAN Analyzer, Shomiti/Finisar Surveyor, Tektronix K12xx, Visual Networks Visual UpTime, WildPackets EtherPeek/TokenPeek/AiroPeek, and many others
- Capture files compressed with gzip can be decompressed on the fly
- Live data can be read from Ethernet, IEEE 802.11, PPP/HDLC, ATM, Bluetooth, USB, Token Ring, Frame Relay, FDDI, and others (depending on your platform)
- Decryption support for many protocols, including IPsec, ISAKMP, Kerberos, SNMPv3, SSL/TLS, WEP, and WPA/WPA2
- Coloring rules can be applied to the packet list for quick, intuitive analysis
- Output can be exported to XML, PostScript®, CSV, or plain text
How to Download and Install Wireshark
The first thing you need to do is download and install it. You can download Wireshark for free from the company website. To have the smoothest running experience, it is advised that you download the latest version available on your platform from the “stable release” section.
Install on Windows
Once you’ve downloaded the program you can start the setup process. During installation, you may be prompted to install WinPcap. It’s important to install WinPcap as without it you will be unable to capture live network traffic. Without WinPcap you will only be able to open saved capture files. To install, simply check the Install WinPcap box.
Let’s look at this in more detail.
Select the installer for your Windows architecture (64-bit or 32-bit) and click on the link to download the package.
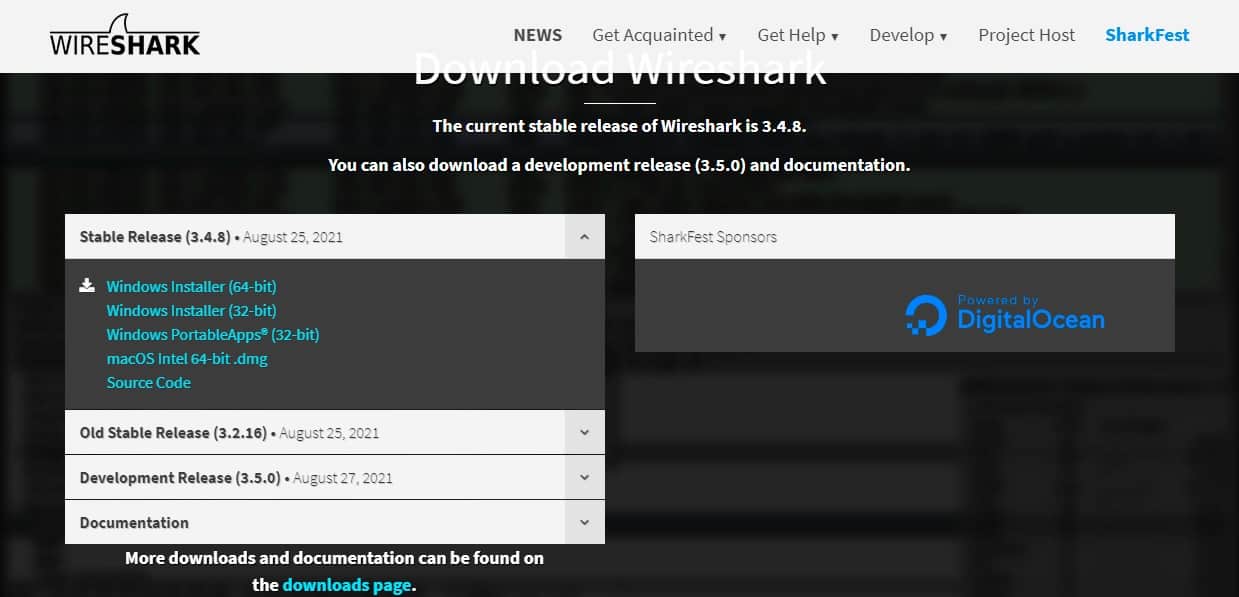
Once the installer is on your computer, follow these steps:
- Click on the downloaded file to run it. Click Yes in the User Account Control window.
- Click Next on the opening screen of the installer.
- In the License Agreement screen, click the Noted button.
- Leave all of the defaults in the Choose Components screen. Click the Next button.
- Leave all settings as they are in the Additional Tasks screen and click on Next.
- In Choose Install Location, just click on Next.
- In the Packet Capture screen, leave the consent box checked and click the Next button.
- In the USB Capture screen, check the Install USBPcap box and press the Install button.
- Let the installation progress. During the process, you will be presented with a consent screen for Npcap. Click on I Agree.
- In the NPcap Installation options screen check Restrict Npcap driver’s access to Administrators only, Support raw 802.11 traffic (and monitor mode) for wireless adapters, and Install Npcap in WinPcap API-compatible Mode. Click on Install.
- When the Npcap setup has finished. Click on Next and then Finish to dismiss that dialogue window. The Wireshark installation will continue.
- In the Installation Complete screen, click on Next and then Finish in the next screen.
Look in your Start menu for the Wireshark icon. Click on it to run the utility.
Install on Mac
To install Wireshark on Mac you first need to download an installer. To do this, download an installer such as exquartz. Once you’ve done this, open the Terminal and input the following command:
<% /Applications/Wireshark.app/Contents/Mac0S/Wireshark>
Then wait for Wireshark to start.
Install on Unix
In order to run Wireshark on Unix, you need a couple of other tools installed on your system first. These are:
- GTK+, The GIMP Tool Kit, and Glib, are both from the same source.
- You will also need Glib. You can get familiar with both tools at https://www.gtk.org/
- libpcap, which you get from http://www.tcpdump.org/.
After installing the above supporting software, and downloading the software for Wireshark, you need to extract it from the tar file.
gzip -d wireshark-1.2-tar.gz
tar xvf wireshark-1.2-tar
Change to the Wireshark directory and then issue the following commands:
./configure
make
make install
You can now run the Wireshark program on your Unix computer.
How to Capture Data Packets
Capturing data packets is one of the main uses of Wireshark as a network investigation tool. For thorough network analysis, it is crucial to learn how to configure Wireshark to collect packets. It’s vital to remember that while using Wireshark for the first time, it can be challenging to capture packets. There are three steps you must do before beginning to capture packets:
- Make sure that you have the administrative privileges to start a live capture on your device
- Choose the correct network interface to capture packet data from
- Capture packet data from the correct location in your network
You are now prepared to begin the capture procedure after completing these three steps. When you use Wireshark to capture packets, they are shown to the user in a format that is easy to read. If you want to examine more detailed information, you may also segment packets using filters and color coding.
When you first open up Wireshark, you’ll be met by the following launch screen:
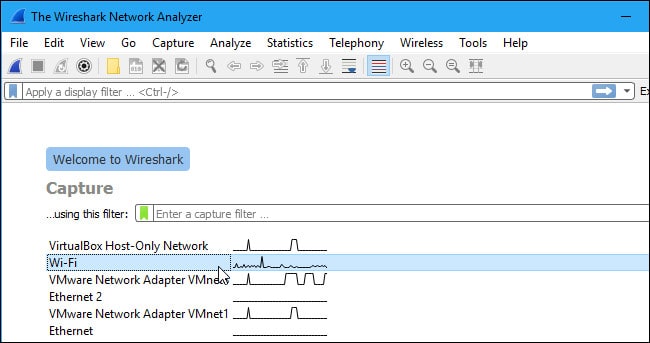
The first thing you need to do is look at the available interfaces to capture. To do this, select Capture > Options. The “Capture Interfaces” dialog box will then open as shown below:

To begin, select the box next to the interface you wish to record, then click the Start button. If you wish to collect data from several sources at once, you can choose different interfaces.
On Unix or Linux, the dialog box is shown in a similar style like this:

You can also start Wireshark by using the following command line:
<¢ wireshark -i eth0 —k>
You can also use the shark fin button on the toolbar as a shortcut to initiate packet capturing. Once you click this button, Wireshark will start the live capture process.
If you want to stop capturing, click the red stop button next to the shark fin.
Promiscuous Mode
You must switch on “promiscuous mode” if you wish to generate an overhead view of your network packet transfers. In promiscuous mode, Wireshark examines each packet it encounters as it passes across the interface. When this mode is turned off, your network is less transparent, and you only get a restricted snapshot of it (this makes it more difficult to conduct any analysis).
To activate the promiscuous mode, click on the Capture Options dialog box and click promiscuous mode. In theory, this should show you all the traffic active on your network. The promiscuous mode box is shown below:
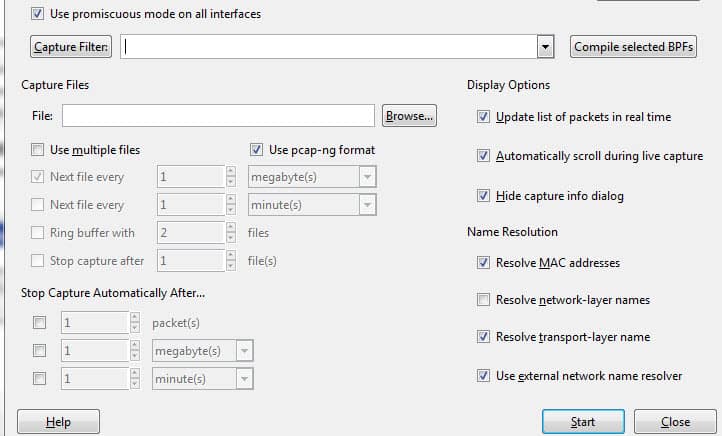
But this frequently isn’t the case. You must visit the Wireshark website to find information about your particular hardware because many network interfaces are resistant to promiscuous mode.
On Windows, it’s useful to open Device Manager and check whether you have your settings configured to reject promiscuous mode. For example:
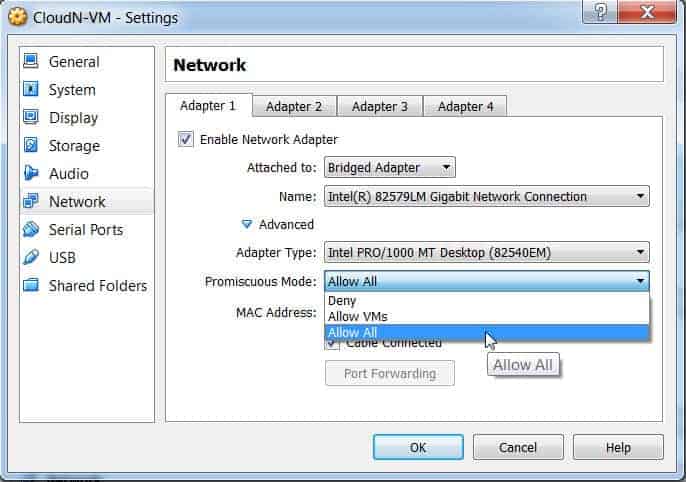
(Simply click on network and then make sure that your promiscuous mode setting is set to Allow All).
Promiscuous mode will be rejected if your settings are set to “reject,” which will reduce the amount of packets Wireshark may collect. Check your Device Manager to make sure that your interface isn’t preventing any data from passing through, even if promiscuous mode is active in Wireshark. By taking the time to look through your network architecture, you can make sure Wireshark gets all the data packets it needs.
How to Analyze Captured Packets
Once you’ve captured your network data, you’ll want to look at your captured packets. In the screenshot below you’ll see three panes, the packet list pane, the packet bytes pane, and the packet details pane.
If you want more information, you can click on any of the fields in each packet to see more. When you click on a packet, you’re shown a breakdown of its internal bytes in the byte view section.
Packet List
The packet list pane is shown at the top of the screenshot. Each piece is broken down to a number with time, source, destination, protocol, and support information.
Packet Details
The middle contains packet information, which display the chosen packet’s protocols. Each segment can be made larger by clicking the arrow next to the row you want to expand. By selecting the item with the right click, you may easily add other filters.
Packet Bytes
The page’s footer displays the packet bytes pane. The internal data of the packet you choose is displayed on this page. When you select a portion of the data in this section and highlight it, the packet details pane also highlights the information that goes with it. By default, hexadecimal format is used to display all data. Right-click the pane and choose this choice from the context menu to convert it to bit format.
Basic concepts of the Network Traffic
Both a local network and the Internet were intended for use in order for the devices to connect with one another. It is employed to identify hosts or network interfaces. It offers the ability to construct a path to the host within that network as well as the host’s location. The set of predetermined guidelines or conditions under which communication should take place is known as the Internet Protocol. IPv4 and IPv6 are the different types of IP addresses.
- IPv4 is a 32-bit address in which each group represents 8 bits ranging from 0 to 255.
- IPv6 is a 128-bit address.
IP addresses: IP addresses are assigned to the host either dynamically or statically. Most private users have dynamic IP addresses, while business users or servers have static IP addresses. Dynamic IP changes whenever the device is connected to the Internet.
Computer Ports: The computer ports work in combination with the IP address directing all outgoing and incoming packets to their proper places. There are well-known ports to work with like FTP (File Transfer Protocol), which has port no. 21, etc. All the ports have the purpose of directing all packets in the predefined direction.
Protocol: The Protocol is a set of predefined rules. They are considered the standardized form of communication. One of the most used protocols is TCP/IP. It stands for Transmission Control Protocol/Internet Protocol.
OSI model: The OSI model stands for Open System Interconnect. The OSI model has seven layers, namely, the Application layer, Presentation layer, Session layer, Transport layer, Network layer, Data Link Layer, and the physical layer. The OSI model gives a detailed representation and explanation of the transmission and reception of data through the layers. The OSI model supports both connectionless and connection-oriented communication modes over the network layer. The OSI model was developed by ISO (International Standard Organization).
How to Use Wireshark Filters
Capture filters give Wireshark instructions to only record packets that satisfy specific requirements. A capture file can also have filters applied to it so that only specific packets are displayed. Display filters are the name given to this.
Wireshark provides a large number of predefined filters by default. To use one of these existing filters, enter its name in the Apply a display filter entry field located below the Wireshark toolbar or in the Enter a capture filter field located in the center of the welcome screen.
For example, if you want to display TCP packets, type TCP. The Wireshark autocomplete feature shows suggested names as you begin typing, making it easier to find the correct moniker for the filter you’re seeking.
:max_bytes(150000):strip_icc():format(webp)/012-wireshark-tutorial-4143298-5e45505c0f434a9ba2d3a8f70a850617.jpg)
Another way to choose a filter is to select the bookmark on the left side of the entry field. Choose Manage Filter Expressions or Manage Display Filters to add, remove, or edit filters.
:max_bytes(150000):strip_icc():format(webp)/013-wireshark-tutorial-4143298-f169e33e47ba4aafb336b9d47029867d.jpg)
You can also access previously used filters by selecting the down arrow on the right side of the entry field to display a history drop-down list.
:max_bytes(150000):strip_icc():format(webp)/014-wireshark-tutorial-4143298-f09d24778ff94ff29a2bbd3ee883fc4c.jpg)
Capture filters are applied as soon as you begin recording network traffic. To apply a display filter, select the right arrow on the right side of the entry field.
What is Network Sniffing?
Network sniffing, also known as packet sniffing or packet capturing, is the process of capturing and analyzing network traffic to inspect and examine the packets traversing a computer network. It involves intercepting and inspecting the data packets that flow between different devices within a network, providing insights into the communication occurring between them.
Network sniffing is typically performed using specialized software tools called network sniffers or packet sniffers. These tools capture packets from the network interface of a device, allowing users to analyze the content and structure of the packets. By examining the captured packets, network administrators, security professionals, and researchers can gain valuable information about network performance, troubleshoot issues, and identify potential security threats.
There are two main methods of network sniffing:
- Promiscuous Mode Sniffing: This method involves putting the network interface into promiscuous mode, which allows it to capture all network traffic passing through the network, regardless of the destination. In this mode, the network sniffer captures not only the packets destined for the device but also the packets intended for other devices on the network. Promiscuous mode sniffing requires appropriate permissions and administrative access to the device.
- Switched Port Analyzer (SPAN)/Port Mirroring: This method involves configuring a network switch or router to copy specific network traffic from selected ports and redirect it to another port designated for sniffing. This enables the network sniffer to capture the mirrored traffic for analysis without disrupting the normal flow of network communication.
Network sniffing serves various purposes, including:
- Network Troubleshooting: By capturing and analyzing network packets, administrators can identify network bottlenecks, diagnose connectivity issues, and pinpoint the source of performance problems. Sniffing allows them to examine packet headers, payload contents, and timing information, enabling efficient troubleshooting.
- Security Analysis: Network sniffing is crucial for detecting and analyzing potential security threats. It enables security professionals to monitor network traffic for suspicious activities, such as unauthorized access attempts, malware propagation, or data breaches. Sniffers can help identify vulnerabilities, monitor for malicious behavior, and aid in incident response and forensic investigations.
- Protocol Analysis: Sniffing allows for in-depth analysis of network protocols, including their behaviors, data structures, and communication patterns. By inspecting protocol-specific packets, developers and researchers can gain insights into how different protocols are utilized, identify protocol-related issues, and develop more efficient and secure protocols.
While network sniffing can be a powerful tool for network analysis and security, it is important to note that its usage raises privacy and ethical concerns. Sniffing network traffic without proper authorization or in violation of privacy laws is illegal and unethical. It is crucial to use network sniffing tools responsibly, ensuring compliance with applicable laws and regulations, and respecting user privacy.
Wireshark Color Rules
While Wireshark’s capture and display filters restrict the packets that are captured or displayed on the screen, its colorization feature goes a step further by being able to discern between various packet types based on their distinct hue. By using their row color in the packet list window, this rapidly identifies specific packets within a saved set.
:max_bytes(150000):strip_icc():format(webp)/wireshark-colors-59512e8f3df78cae8137715b.png)
Wireshark comes with about 20 default coloring rules, each can be edited, disabled, or deleted. Select View > Coloring Rules for an overview of what each color means. You can also add your own color-based filters.
:max_bytes(150000):strip_icc():format(webp)/015-wireshark-tutorial-4143298-91567e80185c4f16bfc46f6793c0301a.jpg)
Select View > Colorize Packet List to toggle packet colorization on and off.
Wireshark Statistics
The Wireshark provides a wide domain of statistics. They are listed below:
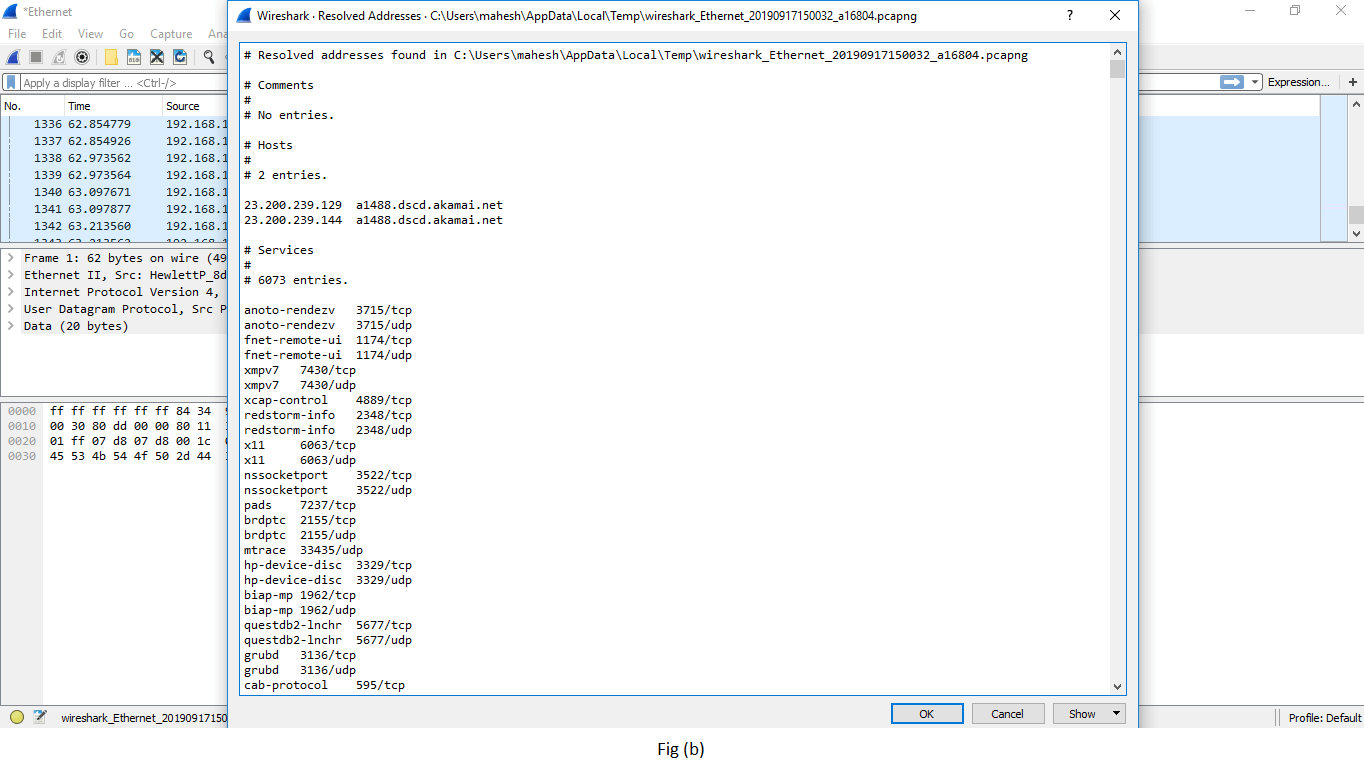
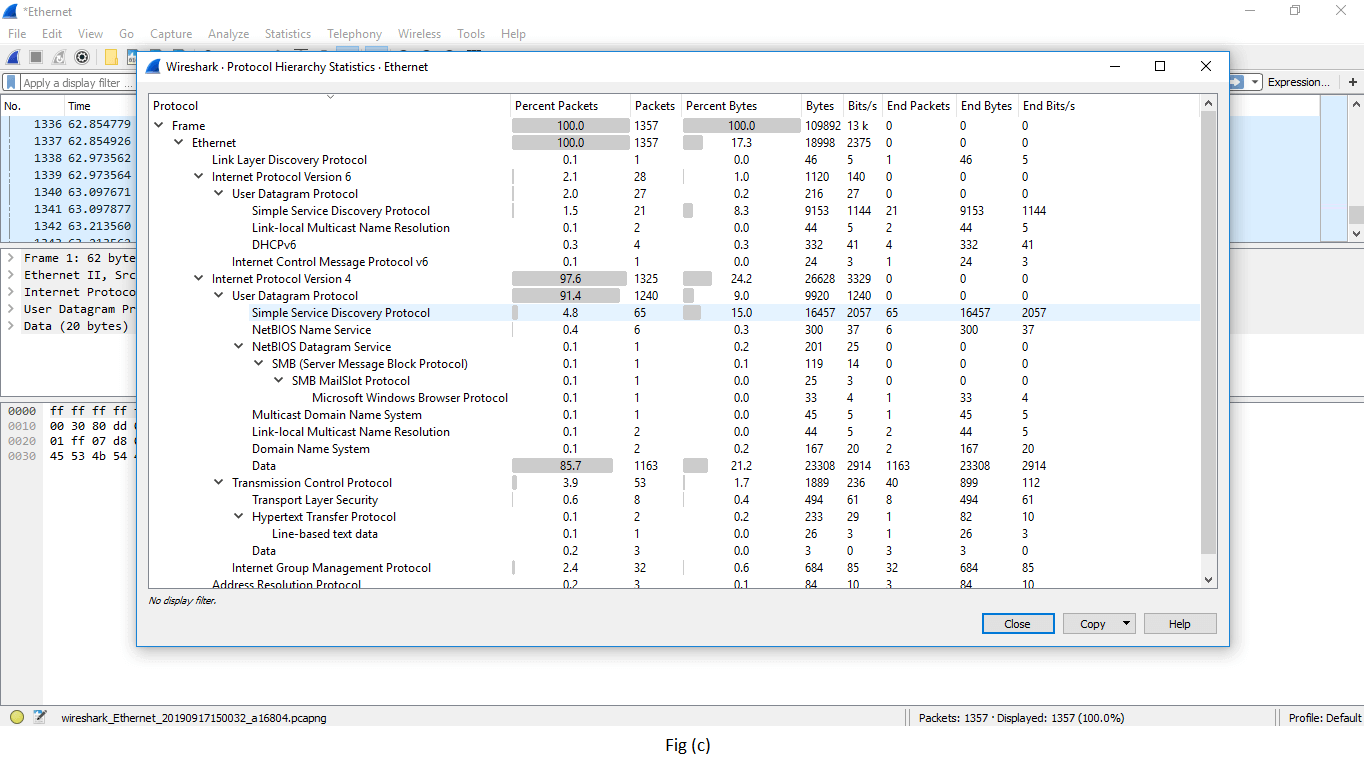
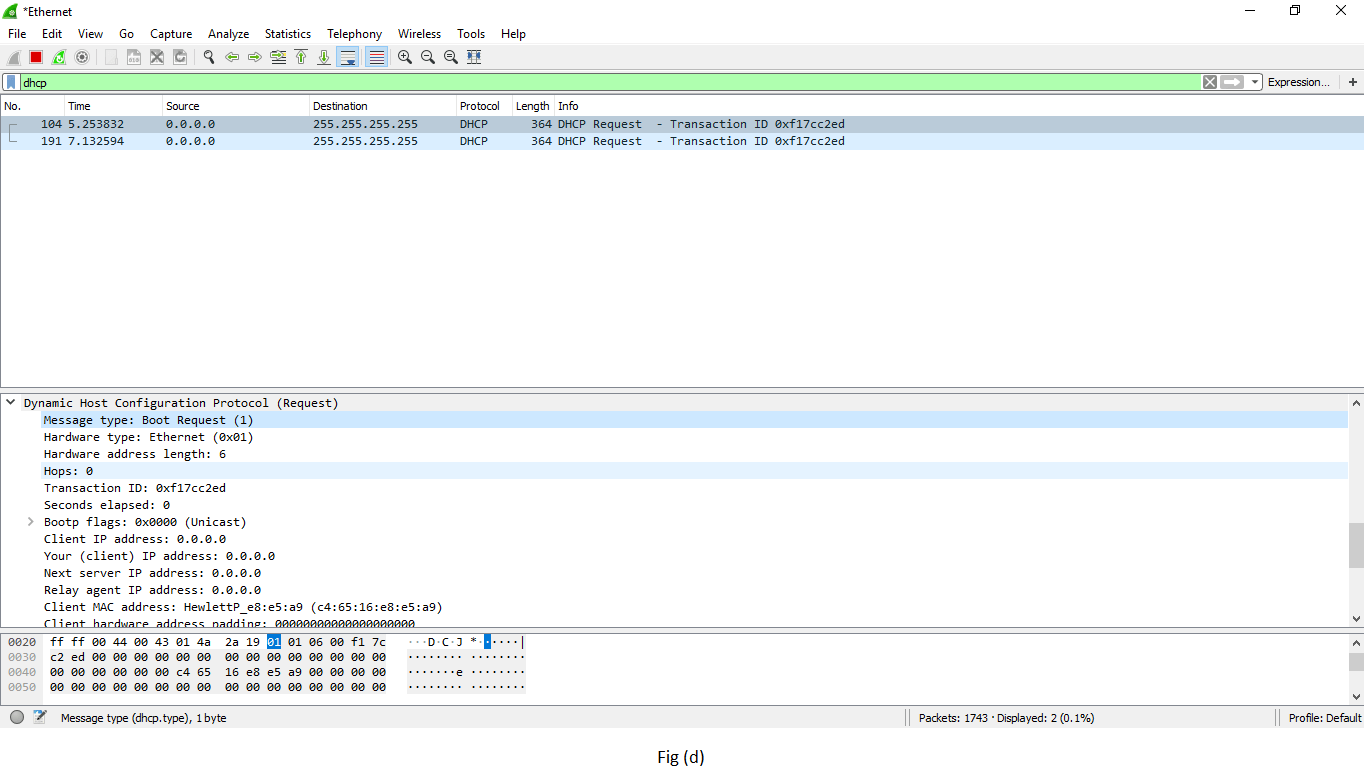
Below is the list of statistics of Wireshark along with the description:
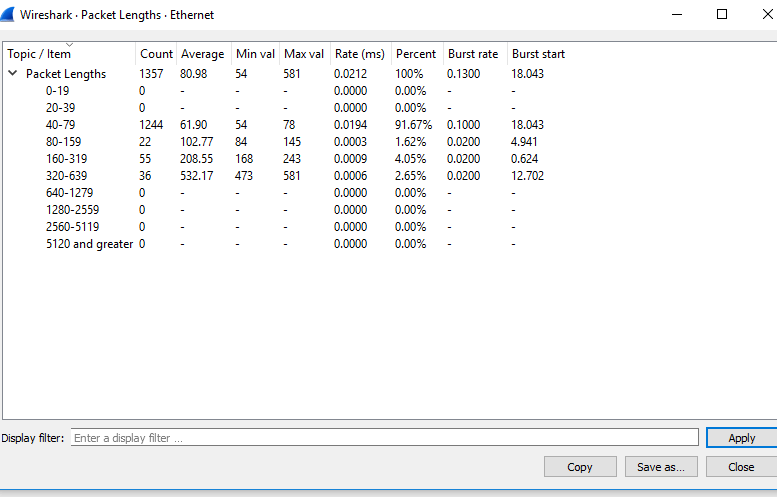
I/O GRAPHS
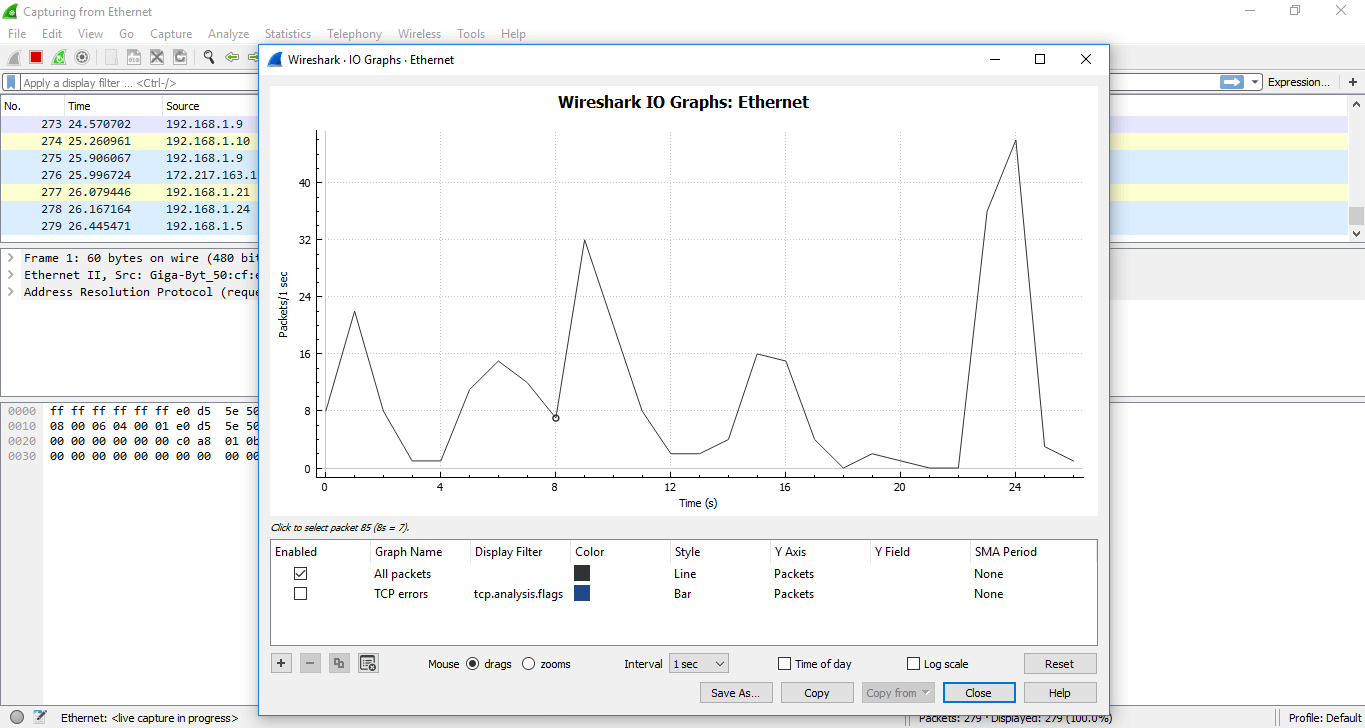
It shows the graph for the network traffic. The graph will look similar but changes as per the traffic involved. There is a table below the figure, which has some filters. Using the ‘+’ sign, you can add more filters, and using ‘-sign you can remove the existing filters. You can also change the color. For every particular filter, you can add a colored layer, which increases the visibility of the graph.
The tick option under the ‘Enabled,’ displays the layer according to your requirements.
For example, we have applied the filter ‘TCP errors’ and the changes can be viewed easily. The image is shown below:
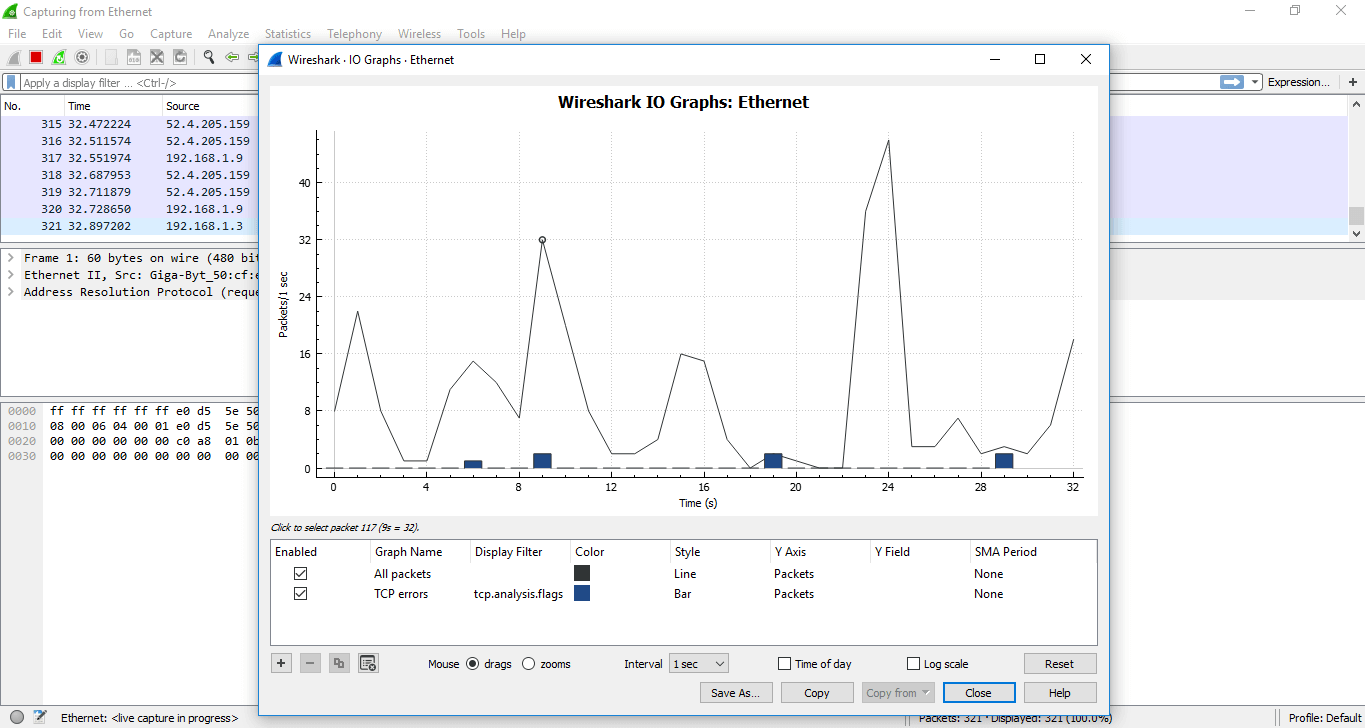
If you click on a certain area of the graph, the corresponding network traffic packet will be shown on the screen. A filter can also be applied to a particular port.
Another category of the graph comes under the option ‘TCP Stream graphs.’
It gives the visualization of the TCP sequence number with time.
Below are the steps to understand the TCP Stream graphs:
- Open the wireshark. Click on the interface to watch the network traffic.
- Apply the filter as ‘TCP.’
- Click on the option ‘Statistics’ on the menu bar and select ‘TCP Stream graphs‘ and select ‘Time sequence (tcptrace). You can also choose other options in the ‘TCP Stream graphs’ category depending on your requirements. Now the screen will look as:
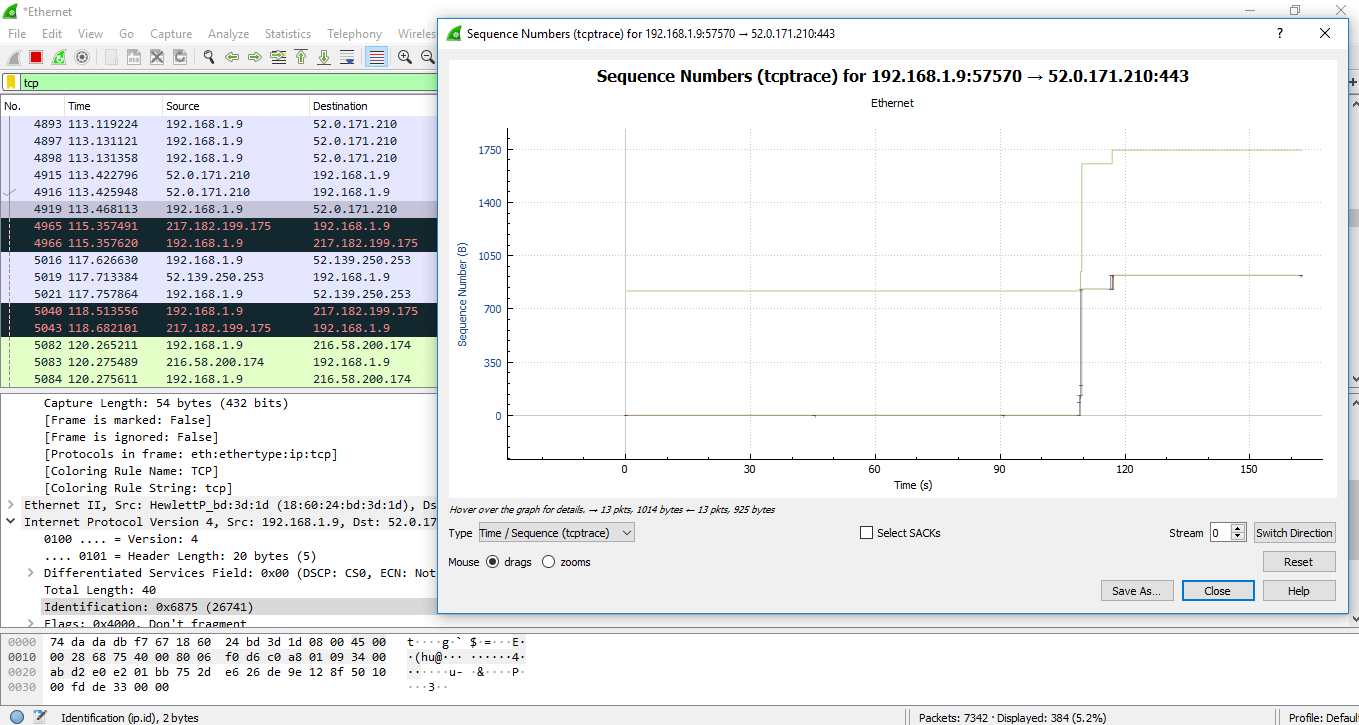
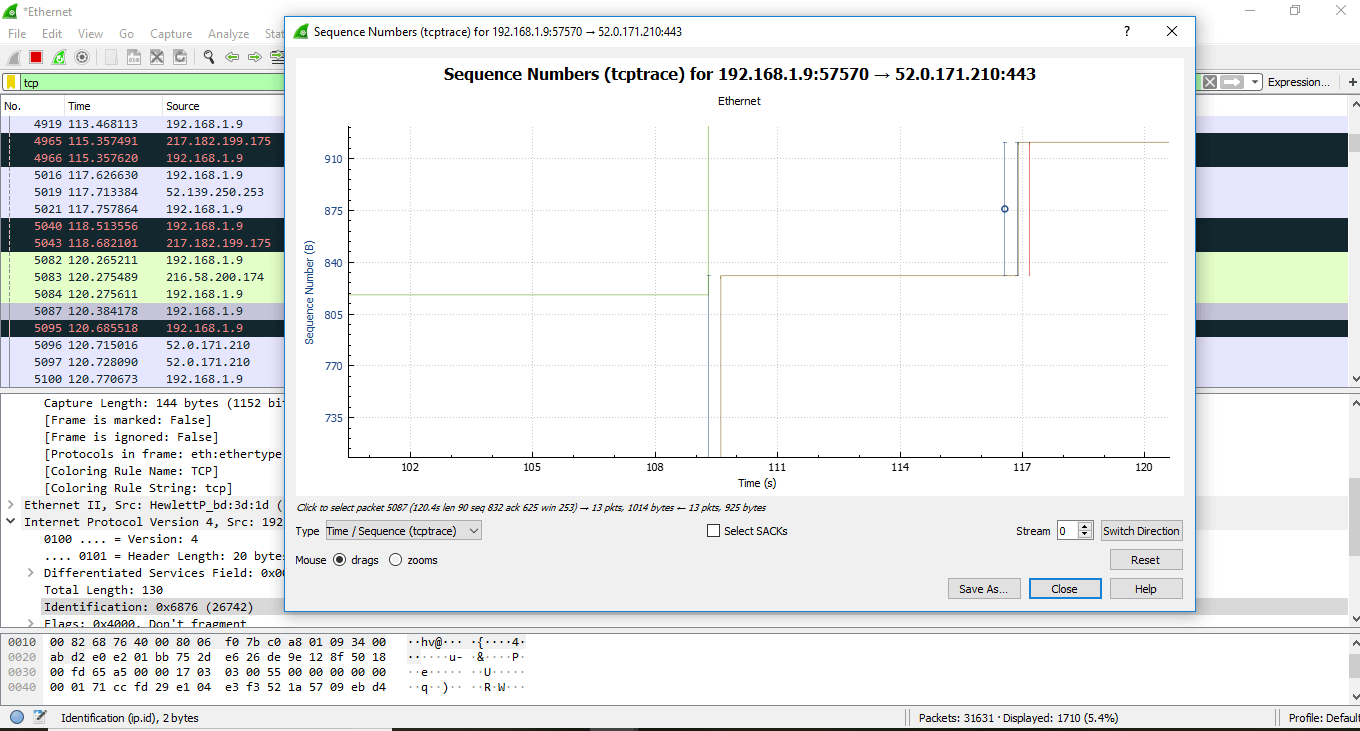
You can now see the points on the graph in more detail because you have zoomed in. Lines are used to represent the packets. The length along the Y-axis displays the packet’s size. Additionally, the green line may be seen ascending before leveling out. This shows that the data was acknowledged (Acknowledged). This value’s increase suggests that more data is being sent.
The data is being sent and then ACK, this is the proper use of the TCP. The flat line here signifies that nothing is happening.
The green line above is called ‘received window.’ The gap between the received window and the packet defines how much space is in the received buffer.
Want to learn more about Wireshark?
Check out the following hour-long webinar titled “Using Wireshark” if you want to go a little bit deeper: An Interactive Demonstration You can watch the video on demand after registering; it is available.
And the table below contains links to Wireshark, as well as actual packet, captures that you can use to learn more. You can even download a quick “cheat sheet” in PDF form from packetlife.net.
Summary
- Network sniffing is intercepting packages as they are transmitted over the network
- Passive sniffing is done on a network that uses a hub. It is difficult to detect.
- Active sniffing is done on a network that uses a switch. It is easy to detect.
- MAC flooding works by flooding the MAC table address list with fake MAC addresses. This makes the switch to operate like a HUB
- Security measures as outlined above can help protect the network against sniffing.
Recommended Articles;
- SQLmap Tutorial
- Pentesting: What It Is, Why You Need It, and How to Get Started
- 121 of the Best Places to Learn to Code For Free
- Top 9 Popular Languages For Backend Web Development
- Full Stack Web Developer Roadmap
- What Is The Dark Web? How To Access It And What You Will Discover
- What Is Cryptocurrency? Everything You Need To Know
- Blockchain Developer Roadmap
- IOS Developers Roadmap 2022
- Game Development Roadmap 2022
- Ethical Hacking Roadmap – A Beginners Guide
- Backend Developer Roadmap – A Beginners Guide
- Best Web Hosting For Developers

2 Comments
I know this site presents quality depending content and extra stuff, is
there any other web site which gives such things in quality?
I am regular visitor, how are you everybody? This paragraph posted at this web site is actually nice.