We often confront with software applications that are either password protected or require certain conditions to proceed. One way to deal with such software applications is to break the security parameters through brute-force attack. However, the brute-force attack can take a lot of time. Therefore, it is not an ideal solution, especially in time-constraint situations where we need quick turnaround. The second option is to break the software into pieces and terminate/bypass or figure out the challenge. This techniques of dismantling the software code is known as reverse engineering. Reverse engineering plays an important role in Cybersecurity, especially during penetration testing and digital forensic tasks. There are multiple opensource and proprietary tools available that can help the security professionals to diagnose software applications through reverse engineering. OllyDbg is one such open-source tool that can perform reverse engineering without having the application’s source code. However, OllyDbg is a 32 bit debugger. Applications with x64 architecture can’t be run in OllyDbg tool. There is another open-source tool called x64dbg with similar look and features. The x64dbg has additional support for x64 programs. This article presents a brief comparison of both tools (OlyDbg and x64dbg) followed by reverse engineering of an application to demonstrate the security evading techniques with these tools.
Key Objectives
1. How to install OllyDbg tool
2. An Overview of OllyDbg features
3. How to install x64dbg tool
4. x64dbg features comparison with OllyDbg
5. How to create a dummy x64 .exe program
6. How to perform reverse engineering of applications using x64dbg tool.
How to Install OllyDbg?
OllyDbg is a 32-bit freeware software debugger. The tool can be used for software debugging process without requiring source code. OllyDbg can be downloaded from the following link.
The tool downloads in a zip format. The zip extraction process leads us to the following directory that contains all the supporting files including the OllyDbg program executable.
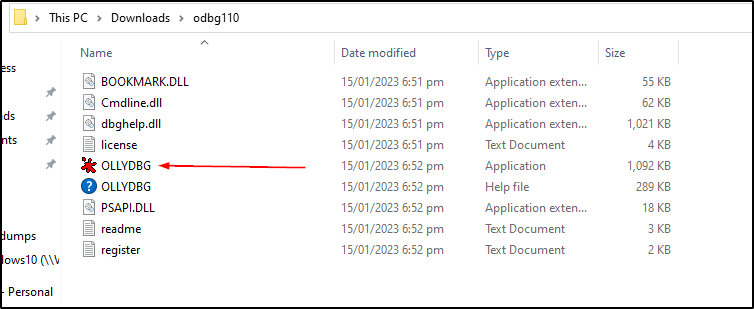
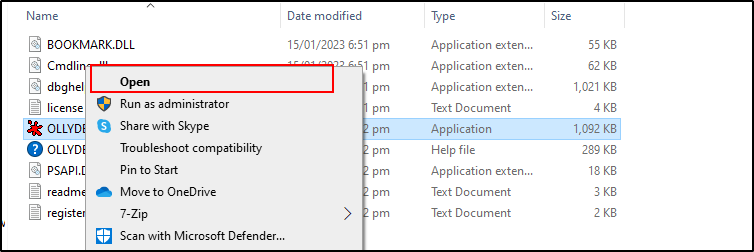
The OlyDbg does not require any further installation. Just open the tool as shown in the following screenshot.
OllyDbg Features
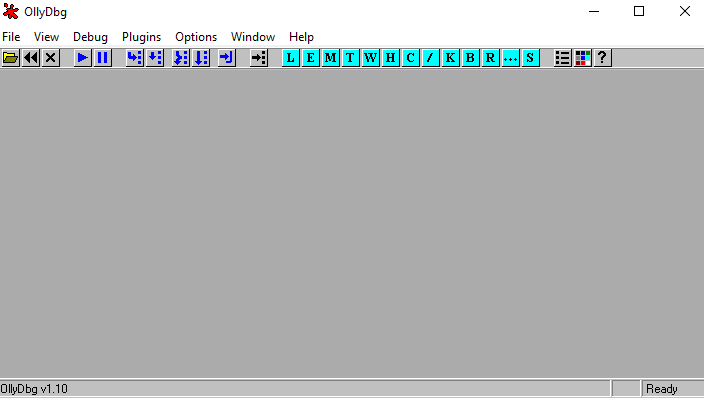
Before running OllyDbg, it is important to understand the basic components of the tool to know its features. Upon execution, the OllyDbg dashboard appears in the following shape.
To better understand the key features of OllyDbg, lets upload a dummy file from the system.
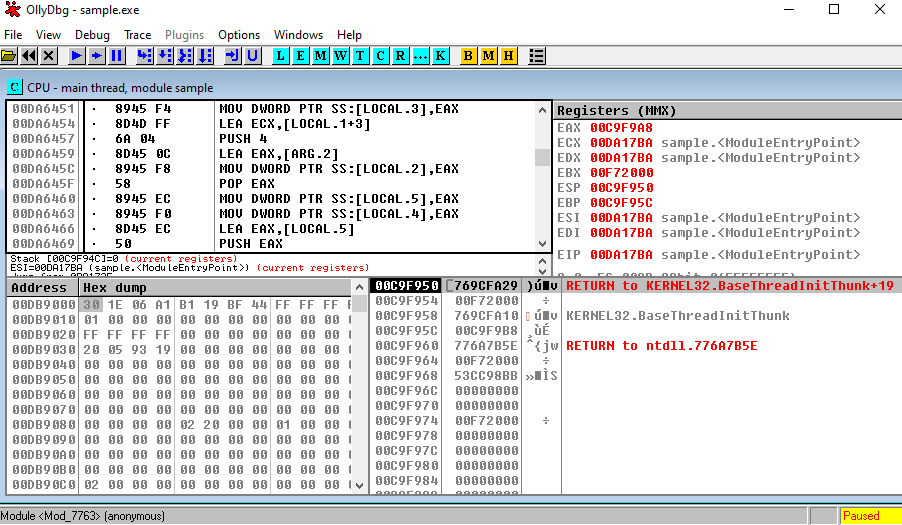
The dashboard can be divided into 4 sections as top left, top right, bottom left, and bottom right part. The top left section shows the debugged program code (instructions in assembly language).
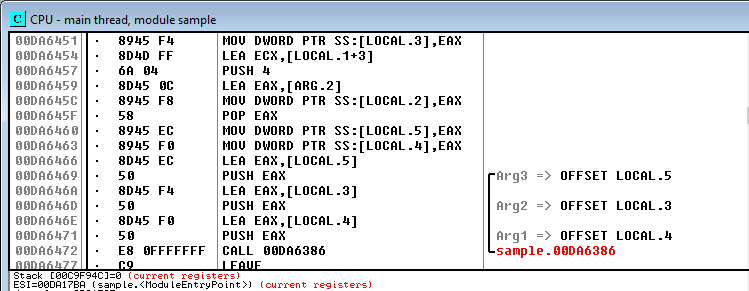
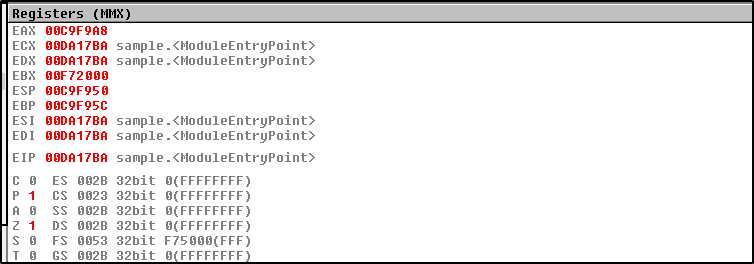
As we know the computer architecture comprises of CPU, memory, and Input/Ouput devices. The CPU has multiple small storages to hold the data to be executed. These places are technically called as registers. The top right section of OllyDbg shows the current registers in use, holding different set of data for the current debugged sample file.
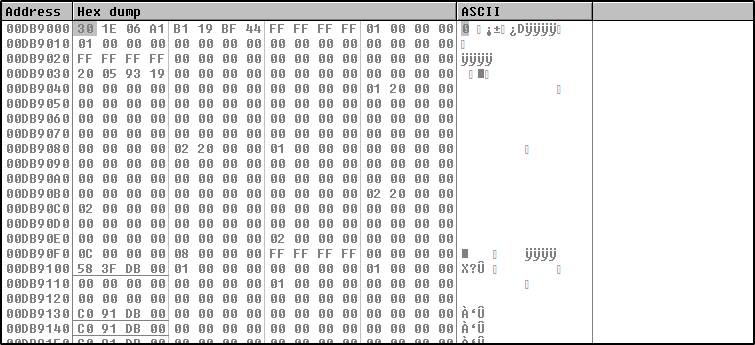
The bottom left section is the memory dump for the current debugged program.
Similarly, the bottom right shows the stack status for the running instructions on OllyDbg. Stack is an abstraction or data buffer that temporarily stores the most recent program requests. If we look at the overall dashboard of OllyDbg, we see several options, tabs, etc. These all together make OllyDbg a powerful debugger. Some key features of OllyDbg tool are explained below.
Code Execution Mode: OllyDbg allows two modes to run a debugged program code. We can run all the program instructions together or we can run line by line code. The later option is a powerful feature that allows to analyze code instructions at very basic level.
Step In / Step Over Feature: A debugged application code may contain hundreds of functions and libraries used in the program. Sometimes it’s vital to investigate a function followed by all the functions associated with it. This can be achieved through Step-In feature. We often see functions that are generic or part of obfuscation strategy applied by the software creator. Its better to skip those functions. OllyDbg can do this by using the Step Over feature.
Breakpoints: As we know the best feature of OllyDbg is to modify and recompile a debugged program. This feature is often referred as patching. But we must have the option to pause the program at certain instructions to analyze the behavior or output of program at those instructions level. For example, lets suppose malicious software (being examined through OllyDbg) that takes data from hard drive and encrypts it before sending to remote server. This encrypted data is very difficult to understand. However, we can use the breakpoints just before the encryption instruction to view what data is being encrypted.
The x64dbg package can be downloaded from the following repository.
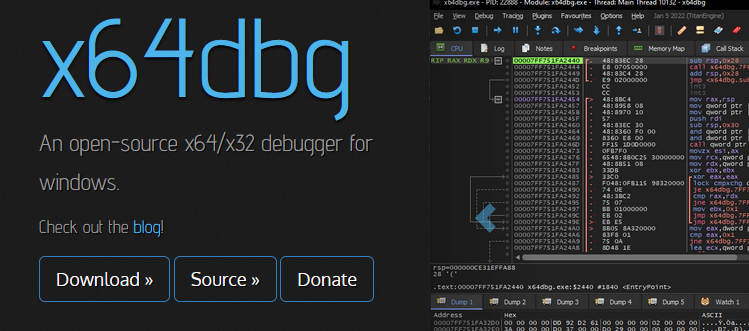
After downloading , un-compress the downloaded directory . Run the following application file to get the x64dbg executable file up and running.
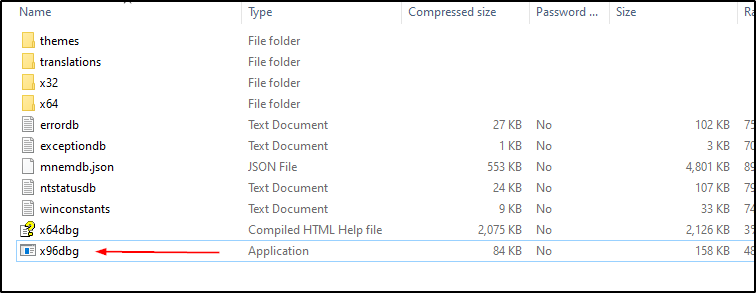
X64dbg Features
The x64dbg dashboard looks almost similar to OllyDbg tool.
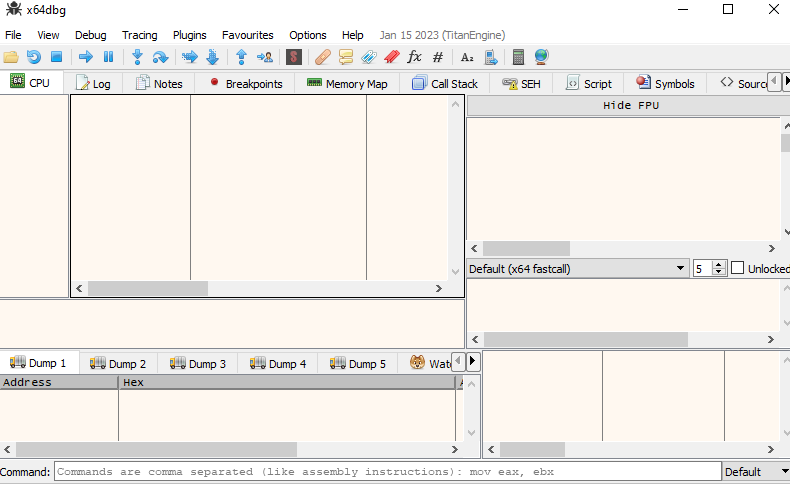
The tool has 4 sections similar to OllyDbg. The memory dump section has more option for dumps as compared to OllyDbg.

The x64dbg also contains the features like custom execution, step into/step over, breakpoints, etc. The main feature that makes x64dbg a preferred choice is its ability to run 32bit/64bit applications. Therefore, in this tutorial, we will use x64dbg tool since we are using a 64bit application for demonstration purpose.
How to Create a Demo Exe Application for Debugging
There are many online repositories available that offer free demo applications to practice the reverse engineering techniques. However, we have opted to create our own application. The purpose of creating a custom application code is to simplify the debugging concept. We have accomplished the task by writing a simple code in C programming using the Codeblocks compiler. The Codeblocks compiler can be downloaded through following link.

After downloading and installation of Codeblocks, open the console by giving a project name to the program. We have called this “hackingloops-pass” project. In the next step, write the desired code to compile it. Since, we are going to demonstrate how to bypass a security check using the x64dbg tool, we have written the following code in the compiler.
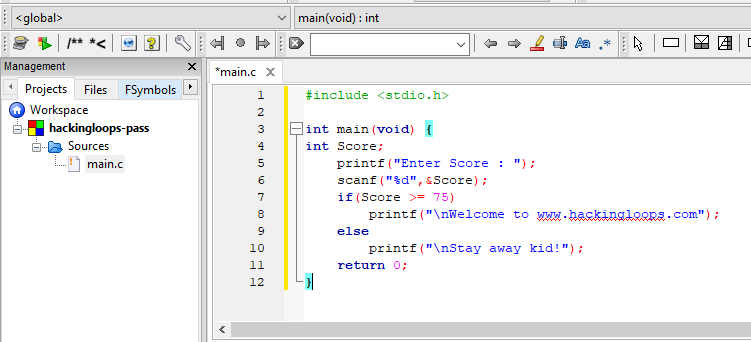
The Blockcodes compiler compiles the code and automatically creates an executable file (application) of the code in the bin folder.

Code Summary: The above code takes an input from the user as a score percentage. If the user score is greater than or equal to 75, he is greeted with the following welcome message: The following screenshot demonstrates the concept.
“Welcome to www.hackingloops.com”

If the user enters the score less than 75, he is warned with the following notice.
“Stay away kid!”

Debugging Objectives: Now lets suppose, we have only the executable file. Our mission is to by bypass the threshold score value of 75 in such a way that we should get the first (greeting) message for any number.
How to Debug Using x64dbg tool
Since we have a x64 file, we will use the x64dbg tool for decompiling and debugging the program. Opening the hackingloops-pass file into x64dbg will disassemble the file into different section as shown in the following screenshot.
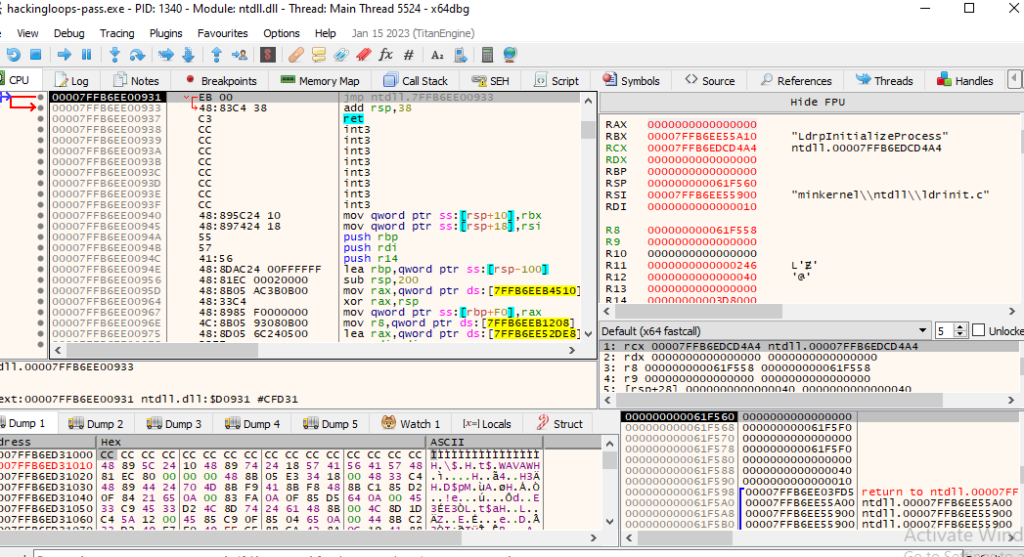
There are many ways to start the debugging process. However, the best practice is to look for strings that appear in the software dialogue box during the user interaction with the software. In x64dbg, we can do so by right-clicking the code/instructions panel section and selecting the reference strings options through search option.
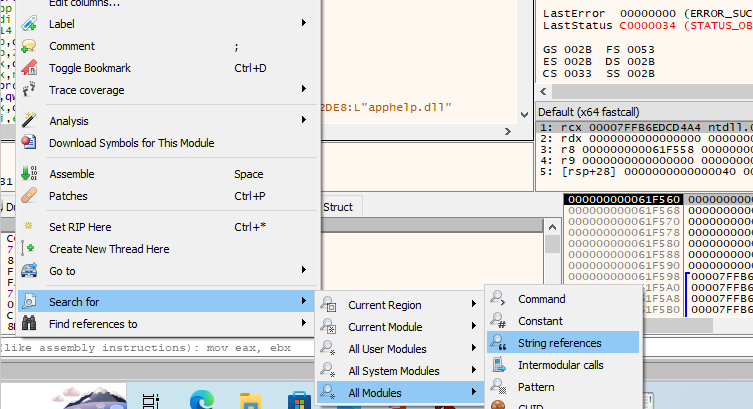
This action brings us to dashboard view containing all the strings in the program. Our objective is to look for strings that belong to success or error messages displayed after user input. These strings can be seen in the following screenshot.
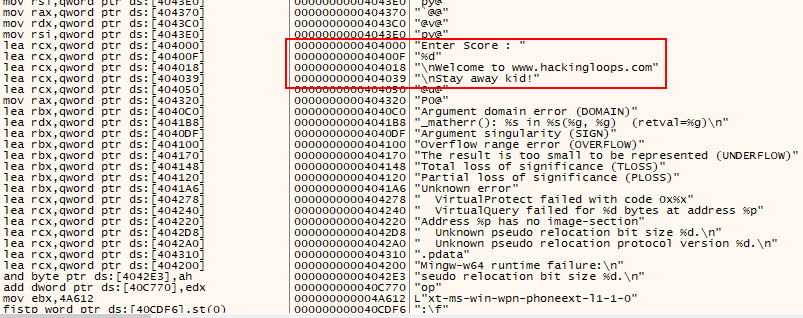
From the above strings, we can interpret the situation. The first string belongs to user input. The second string does the comparison. The program displays one of the remaining two strings in the highlighted box, based on user input. If we double-click on the string that is related to the comparison action, the x64dbg takes us exactly to the process address as shown in the following screenshot.
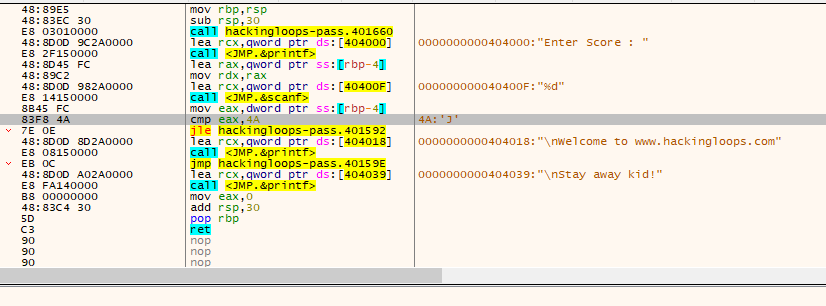
Theoretically, if we disable this comparison, the program will bypass the threshold score (75) check and take us to the ‘welcome message’ for any score. The comparison can be disabled by modifying the registers with null values as shown in the following screenshot.
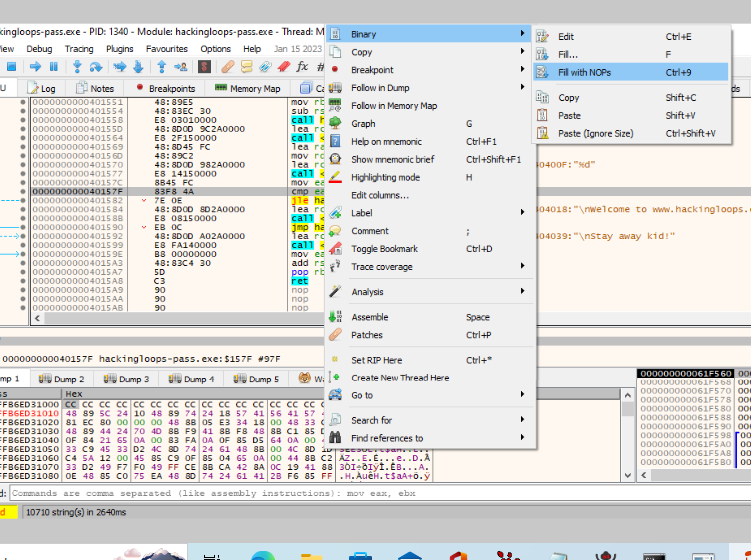
Now, we can recompile the disassembled code through patch option in x64dbg tool.
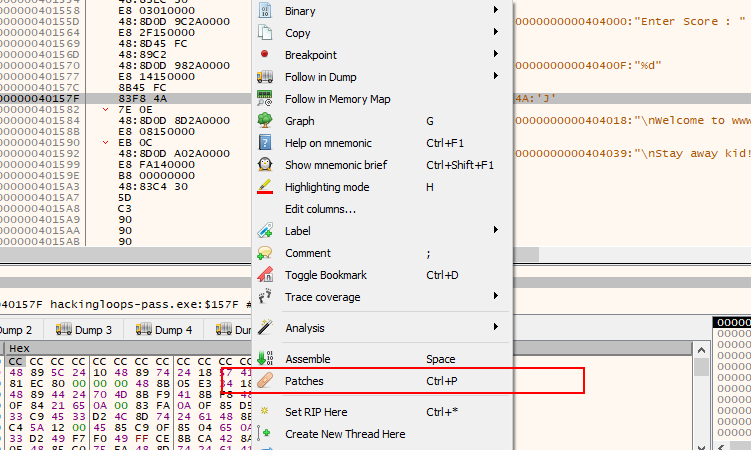
Click on patch file option and save the code with any name. We have saved the program with “hacking-loops-modified.exe” name.

Now, we can execute and test the modified application. First, we will provide a bigger score than 75 threshold value to see the response. The application greeted with the welcome message with >75 score input.

Now, lets insert a smaller number (e.g 35) to see if we have managed to bypass the application threshold protocol.

The program shows the same greeting message as expected. Hence, we have managed to bypass the condition of 75 as threshold value for welcome message.
We have applied the simple greeting message in the demonstration. The same idea can be applied to software that ask for a password to proceed or meet other conditions.
Conclusion
Reverse engineering is a great skill to modify software without source code. Penetration testers and Digital forensic experts can use this skill to accomplish the goals like breaking into a software and performing the data analysis on restricted applications. Tools like Ollydbg and x64dbg provide a great GUI environment to perform these tasks. However, solid understanding of assembly language and computer architecture is must to use these tools.

1 Comment
Great post, you have pointed out some fantastic points, I likewise conceive this s a very fantastic website.